Geo Bubble Chart
A Geo Bubble Chart is a data visualization that combines a Geo Chart and a Bubble Chart to represent geographic data with an additional variable. It displays bubbles of varying sizes over a map, where:
- The location (latitude/longitude) determines where the bubble is placed.
- The size of the bubble represents a numerical value, such as population, sales, or revenue.
Steps to geo bubble chart
- Select geo bubble chart from the list of charts
- Drag and drop Latitude onto Latitude drop zone
- Drag and drop Longitude onto Longitude drop zone
- Drag and drop numerical field onto Numerical Value drop zone
- Click on Get Result button
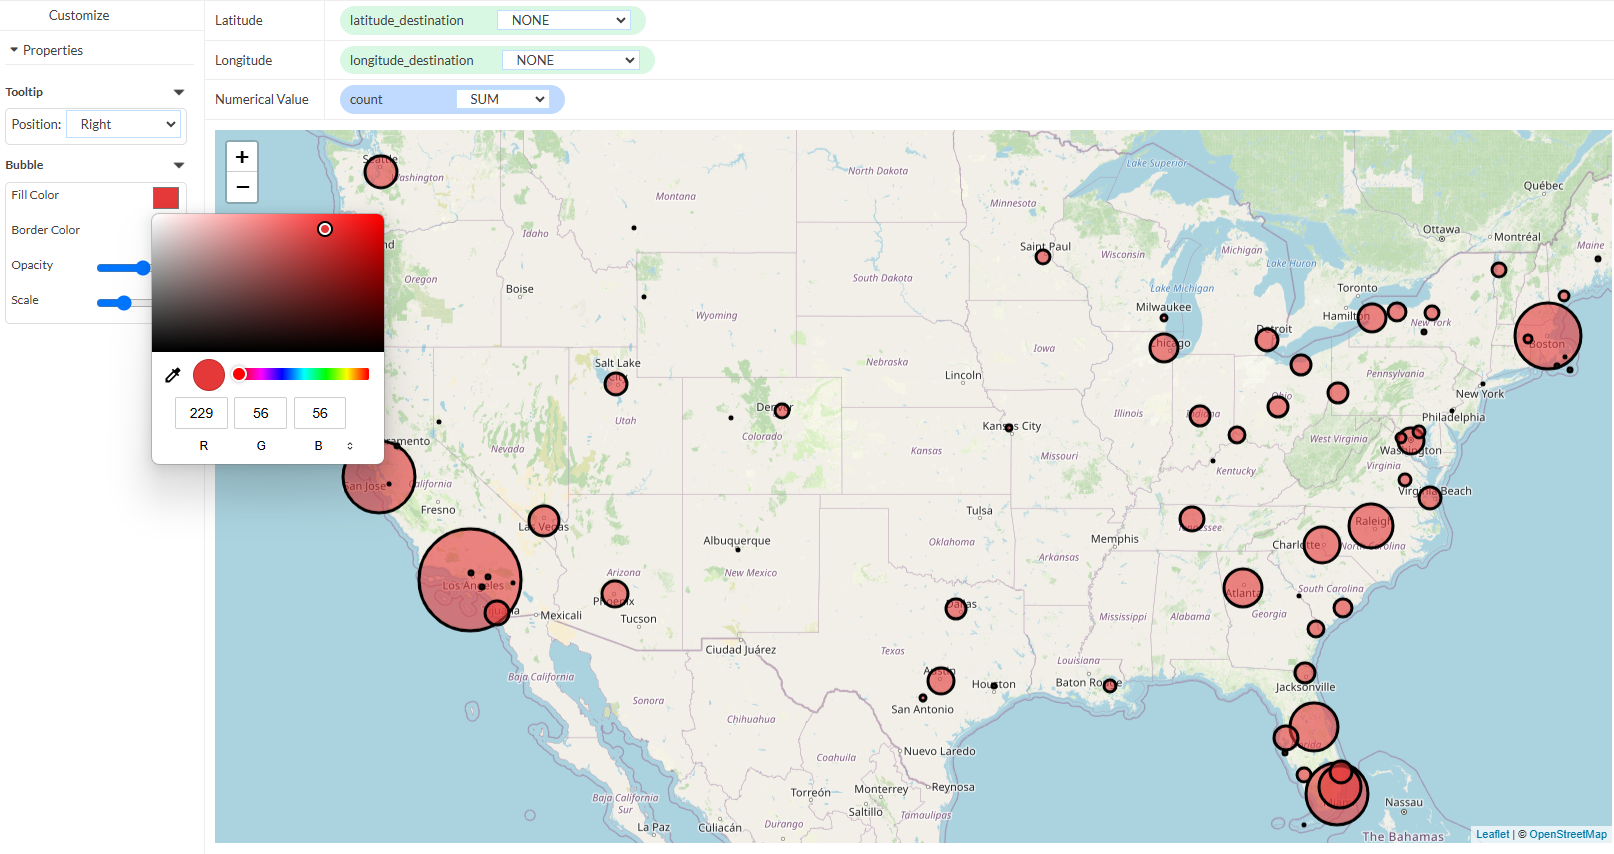
Customization of geo bubble chart
In the current release, below customizations are available:
- Fill Color: Customize the bubble's interior color.
- Border Color: Adjust the outline color to enhance visibility and differentiate bubbles.
- Opacity: Control transparency to avoid overlap and improve data clarity.
- Scale: Resize bubbles proportionally to reflect data magnitude accurately.
Importance of Geo Bubble Charts in Reporting
- Geographical Insights – Helps in understanding location-based trends, such as sales performance across different regions.
- Easy Comparisons – Quickly identifies high-performing and underperforming regions at a glance.
- Business Intelligence – Essential for industries like retail, logistics, and marketing to track distribution, customer density, and revenue by location.
- Improved Decision-Making – Helps executives and analysts make data-driven decisions based on geographical patterns and trends.
Geo Bubble Charts are widely used in dashboards and reports, making complex data easy to interpret for stakeholders.