Pie Chart
A pie chart is a circular statistical graphic that is divided into slices to illustrate numerical proportions. Each slice of the pie represents a category's contribution to the whole, making it easy to visualize relative sizes and comparisons among different categories.
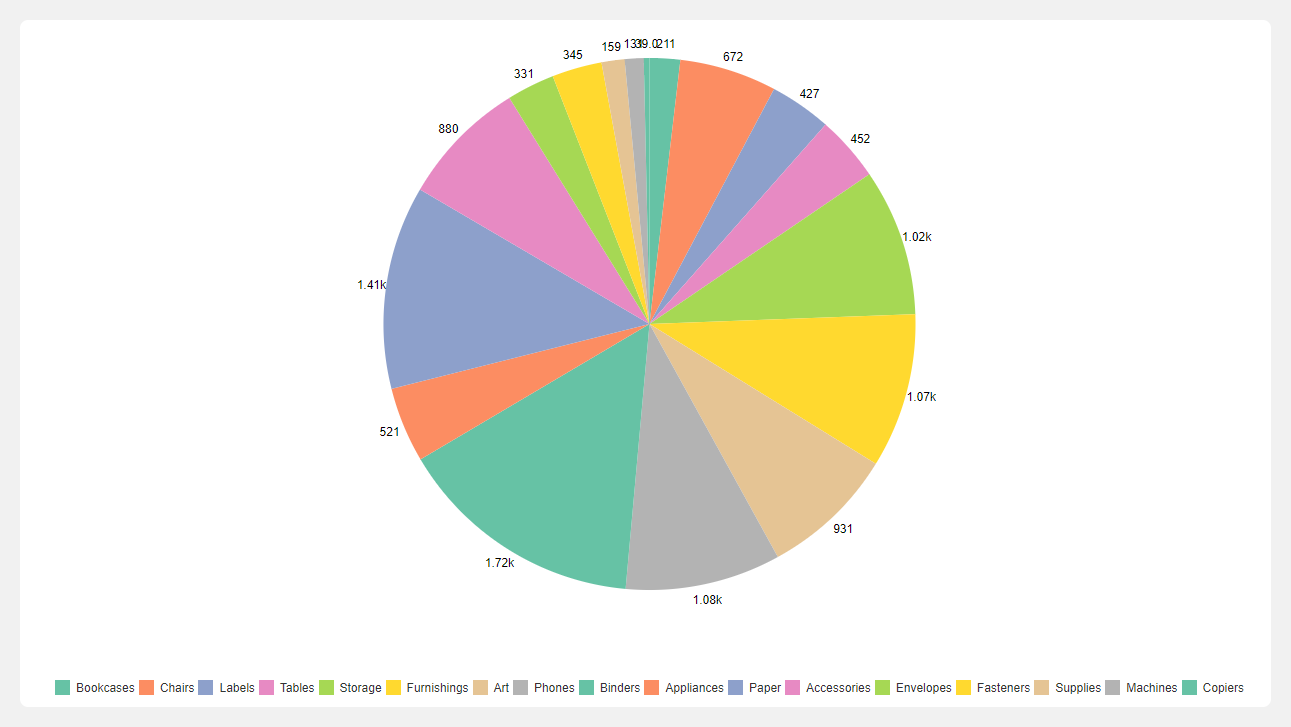
Steps to create pie chart
- Select the Pie chart from the list of available charts.
- Drag and drop a categorical or date field into the categorical drop zone.
- Drag and drop a numerical field into the numerical drop zone.
- Click the Get Result button to generate the chart.