
2025-09 v1

Introducing AI-Powered Conversational Analysis

Conversational Analysis

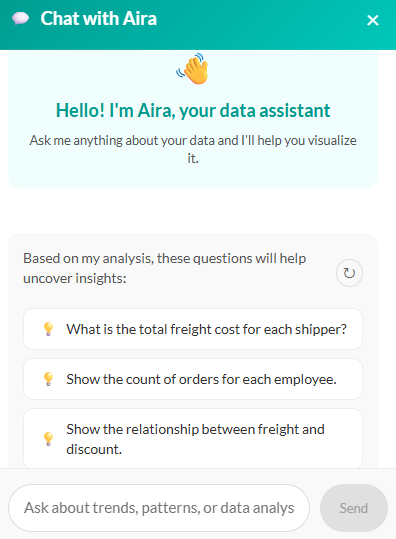
We’re thrilled to unveil the next evolution of Grafieks: Conversational Analysis - where interacting with your data feels just like having a conversation with an AI data analyst.

What’s new:

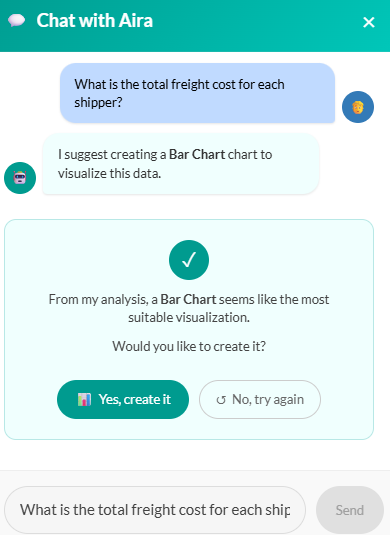
  • Interactive Chat Interface: Ask questions, explore trends, and receive actionable insights in real-time through a chat-style conversation.
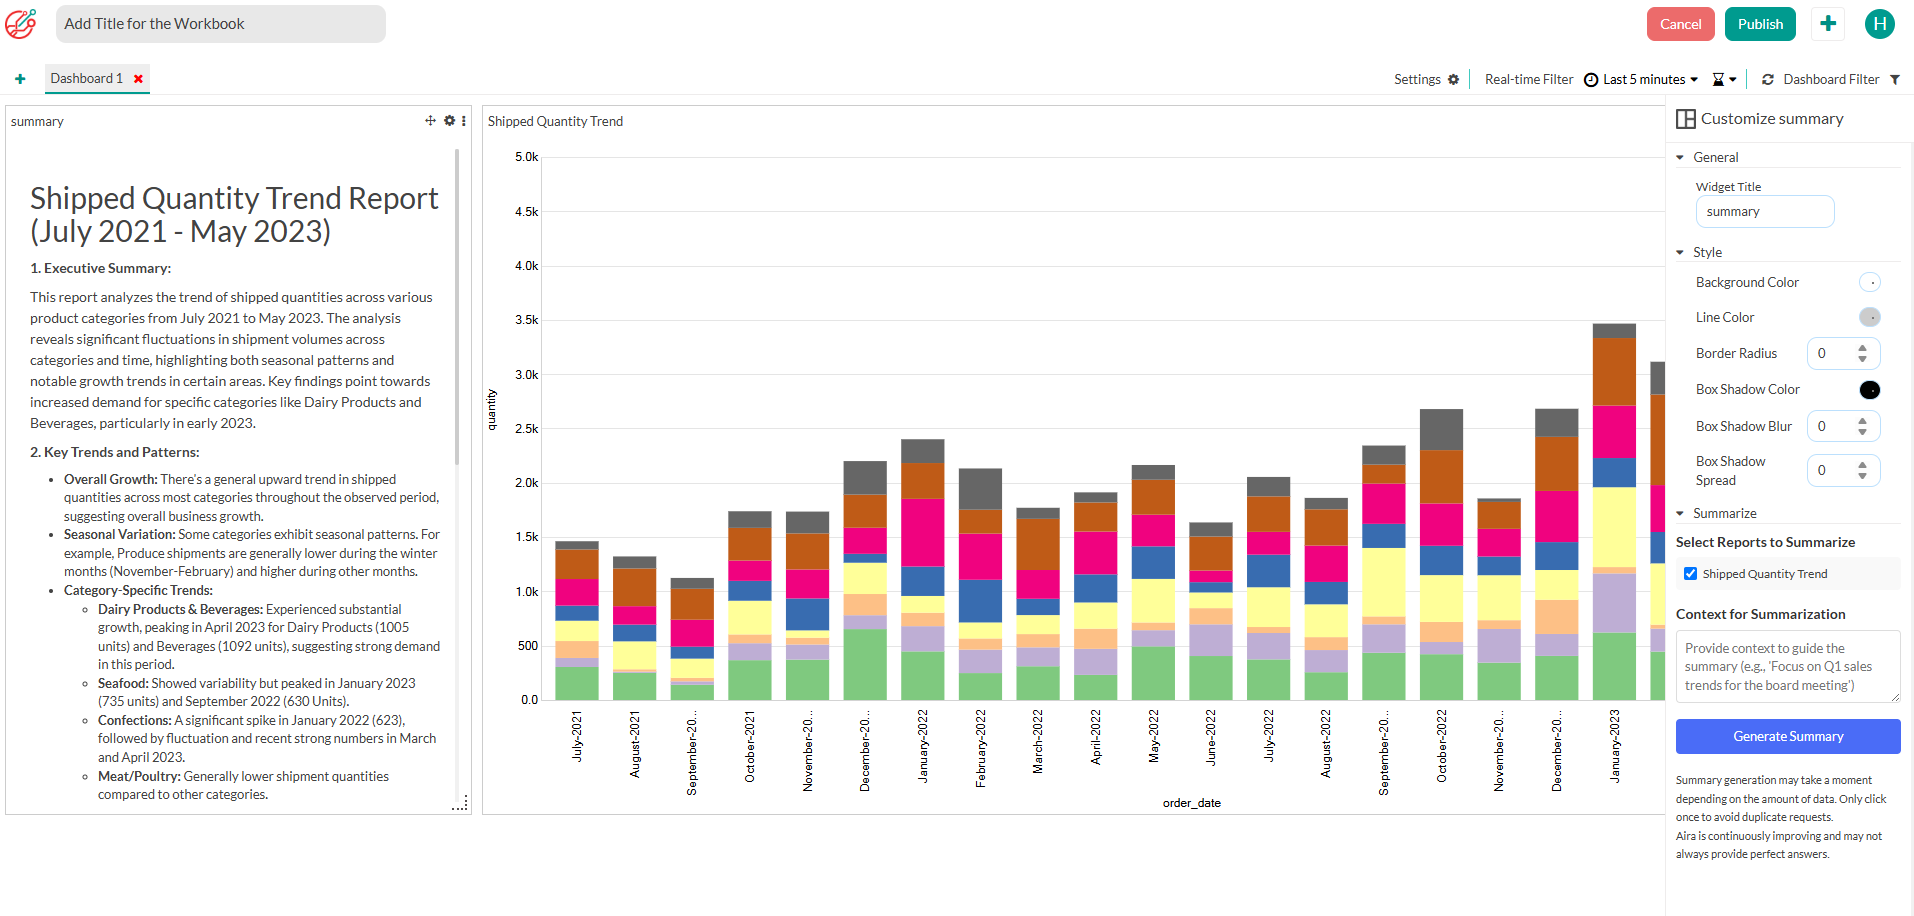
  • Smart Insights & Summaries: The AI doesn’t just respond—it analyzes your data and highlights key findings, patterns, and anomalies automatically.
  • Persistent Chat History: Every conversation is saved in a threaded menu, so you can revisit insights anytime.
  • SQL Transparency: Behind every insight, the AI generates SQL queries you can view, ensuring transparency and trust in your results.
  • Editable & Savable Reports: Transform chat insights into fully editable reports and save them to your dashboard for ongoing analysis.

Why it matters:

This feature turns data exploration into an intuitive dialogue. Teams can ask questions, follow leads, and generate actionable reports—all without leaving the chat interface. It’s the fastest, most natural way to turn curiosity into decisions.

With Conversational Analysis, your AI assistant has evolved from a report builder into a trusted, interactive analyst—ready to help you discover insights faster than ever.

2025-08 v0.6

From Spreadsheet to Insights in Minutes

Spreadsheets are everywhere—but turning them into insights is often harder than it should be. Picture this:

  • Customer survey results sitting in Excel
  • A CRM export in CSV format
  • A delivery report arriving as an email attachment

Traditionally, analyzing these files meant:

  • Raising tickets with data engineering
  • Setting up one-off ETL jobs
  • Wrestling with database access
  • Waiting hours (or days) to start exploring

Not anymore.

With Grafieks, you can now upload CSV or Excel files directly into the platform and analyze them instantly with our in-memory processing engine. And with AI, finding insights is faster than ever.

What’s New

  • CSV & Excel Import – Bring your datasets into Grafieks in just a few clicks.
  • In-Memory Analysis – No waiting around; process data instantly with Grafieks's high-performance engine.
  • Faster Insights – Explore, filter, and visualize imported data without external dependencies.

Why It Matters Until now, analysis in Grafieks was limited to connected data sources. With this release, you can upload flat files and still take advantage of Grafieks’s scalable in-memory technology, enabling you to:

  • Quickly analyze ad-hoc datasets.
  • Combine spreadsheet-based data with connected sources.
  • Empower business users to explore insights without IT support.

From inbox to insights—no pipelines, no waiting.

Import CSV

2025-05 v0.5

We’re excited to announce five powerful new features in Grafieks that significantly enhance how teams explore, understand, and communicate data. Here's what’s new:

1. AI-Powered Data Discovery

Unlock smarter analytics with AI-powered insight prompts. Grafieks now automatically surfaces trends, anomalies, and correlations from your datasets—helping you ask better questions and spot what matters faster. Grafieks also suggests the best chart type for each insight query, so you can visualize your findings in the most effective way—instantly.

AI-Powered Insight Suggestions

AI-Powered Chart Suggestions

2. Automated Report Summaries (with Zero Data Exposure)

No more manual summaries. Grafieks now generates natural-language report overviews—without exposing raw data. These AI-written summaries give stakeholders quick, secure access to key takeaways.

AI-Powered Chart Summary

3. Custom Fields

You asked, we delivered. Create custom expression —no code or data team required. Define your own formulas, KPIs, and metrics using built-in functions and expressions tailored to your business needs, and see changes instantly reflected in visualizations.

Custom Field/Custom Expression

4. Native dbt core Integration

Bring modeling and metrics to the forefront with first-class dbt Core support. Grafieks syncs your dbt projects—including models, tests, and descriptions—so your metrics are always in context and always up-to-date.

5. Unified Data Catalog

Explore your data in one place. Our new catalog view lets users browse tables, metadata, metrics from dbt, and custom fields—all searchable, all connected. Built for discovery and governance, side by side.

Data Catalog

2025-03 v0.4

1. Conditional formatting in a Pivot Table

You can now apply conditional formatting in a pivot table. It will enable you to highlight specific values based on conditions, making it easier to analyze data.

Pivot Conditional formatting

2. Enhanced Text Widget with a built-in Text Editor

A new Text Editor has been introduced for the Text Widget, allowing for easier formatting and customization.

Text Editor

2025-02 v0.3

1. Geo bubble chart

You can now use geo bubble chart to display information on a map, making it easier to analyze geographic trends and distributions.

Geo Chart

2. Pinning items to your homepage

You can pin essential items to the homepage for easy and quick access, ensuring that frequently used items are always readily available whenever you need them. This helps improve efficiency and saves time by reducing the need to search for them manually.

Pin Items

2025-01 v0.2

1. Receive alerts based on data conditions

You can now set up Data Alerts and get notified via email or in-app notification channel. This enhancement is designed to give you flexibility and control, making it easier to set up data alerts. Unlike other BI tool, you have two options:

i. Set up a condition without a timestamp: You can configure a condition that evaluates based on both categorical and numerical data without involving timestamps. For example, a condition might check if a product category matches a specific value (categorical) and whether the associated numerical value, such as price or quantity, exceeds a defined threshold. This allows you to set flexible conditions that work independently of time, focusing solely on the data attributes.

ii. Set up a timestamp condition: Timestamp-based conditions can be configured to evaluate only when the timestamp falls between the last run and the next run of the scheduler. For instance, this is useful in scenarios where you want to process data or trigger actions only for events or records that occurred within a specific time window, ensuring the condition is aligned with your scheduler's execution intervals.

Data Alert

2. New and improved Pivot table for live data connect

Experience improved performance with this enhancement—pivot tables now render faster than ever. Analyze your data seamlessly without delays.

Pivot

3. Increased width of maximized report view

This enhancement provides improved visibility for widget content, especially in report widgets, ensuring clearer and more accessible insights.

3. "All" option added in the filter

The filter now includes an 'ALL' option, making it easier to view and analyze comprehensive data at once.

4. Real-Time Streaming Now Supported in KPI Charts and table

KPI charts are now available for real-time streaming, enabling dynamic tracking of key performance metrics.

Real-time KPI

2024-11 v0.1

In this release we are:

  • Ending Support for Grafieks Desktop : We will be discontinuing support for Grafieks Desktop. However, the source code will remain available on GitHub for those who wish to continue using or modifying it independently.
  • Fully Transitioning to Cloud: We’re now offering Grafieks exclusively as a cloud-based application, providing enhanced accessibility and seamless updates. This strategic move aligns with our commitment to providing you with an enhanced and seamless user experience. By transitioning to Grafieks Cloud, you will benefit from:
    1. Accessibility: Access Grafieks Cloud on any device with an internet connection.
    2. Real-time Updates: Enjoy instant updates and improvements without the need for manual installations.
    3. Collaboration: Facilitate smoother collaboration among team members regardless of their location.
    4. Security: Enhanced security measures to safeguard your data and privacy.

Features migrated from Grafieks Desktop to Grafieks Cloud:

  1. Data connector
  2. Data modeler
  3. Report builder
  4. Dashboard builder
  5. Report and dashboard filter

New feature and enhancements:

  1. Table update: Our new table performs excellent with large datasets. Key Features: Virtual Scrolling, Cross-Browser Compatibility, Data Export and more.

    Please be aware that this speed improvement focuses solely on the visualization rendering and does not impact query performance. However, rest assured that we are actively working on enhancing query speed as well!

    P.S. We're also working on similar enhancements for our Pivot table visualization, so stay tuned for updates!"

  2. Real-Time streaming data connector: This new connector is called Grafieks Real-time analytics. It connects Grafieks Cloud to your streaming data source, ingests data in real time, and delivers insights on live charts instantly. Users can customize the data window and set their preferred refresh rate for optimal monitoring.
    This release introduces compatibility with MySQL, with support for additional streaming data sources planned in future updates.

  3. Real-time charts:

    • Bar Chart
    • Line Chart
    • Area Chart

Deferred features for future releases

  1. Data Import: Excel, CSV and Google Sheets