2025-05 v0.5
We’re excited to announce five powerful new features in Grafieks that significantly enhance how teams explore, understand, and communicate data. Here's what’s new:
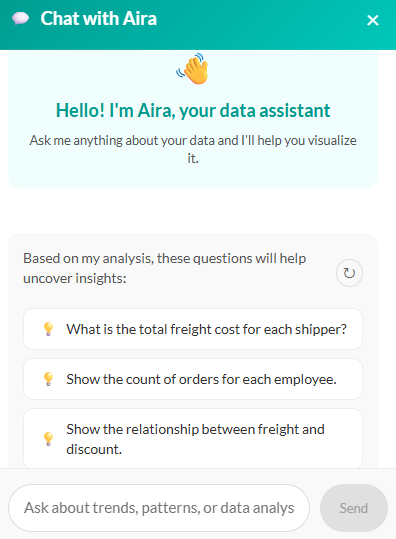
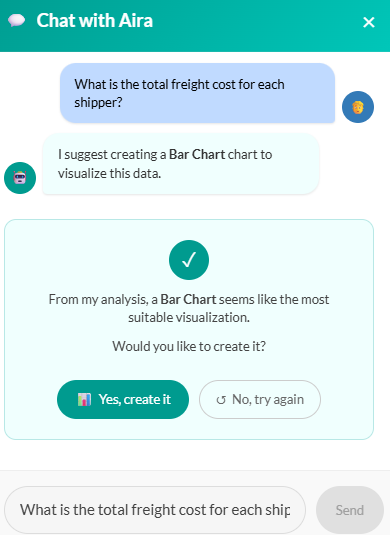
1. AI-Powered Data Discovery
Unlock smarter analytics with AI-powered insight prompts. Grafieks now automatically surfaces trends, anomalies, and correlations from your datasets—helping you ask better questions and spot what matters faster. Grafieks also suggests the best chart type for each insight query, so you can visualize your findings in the most effective way—instantly.
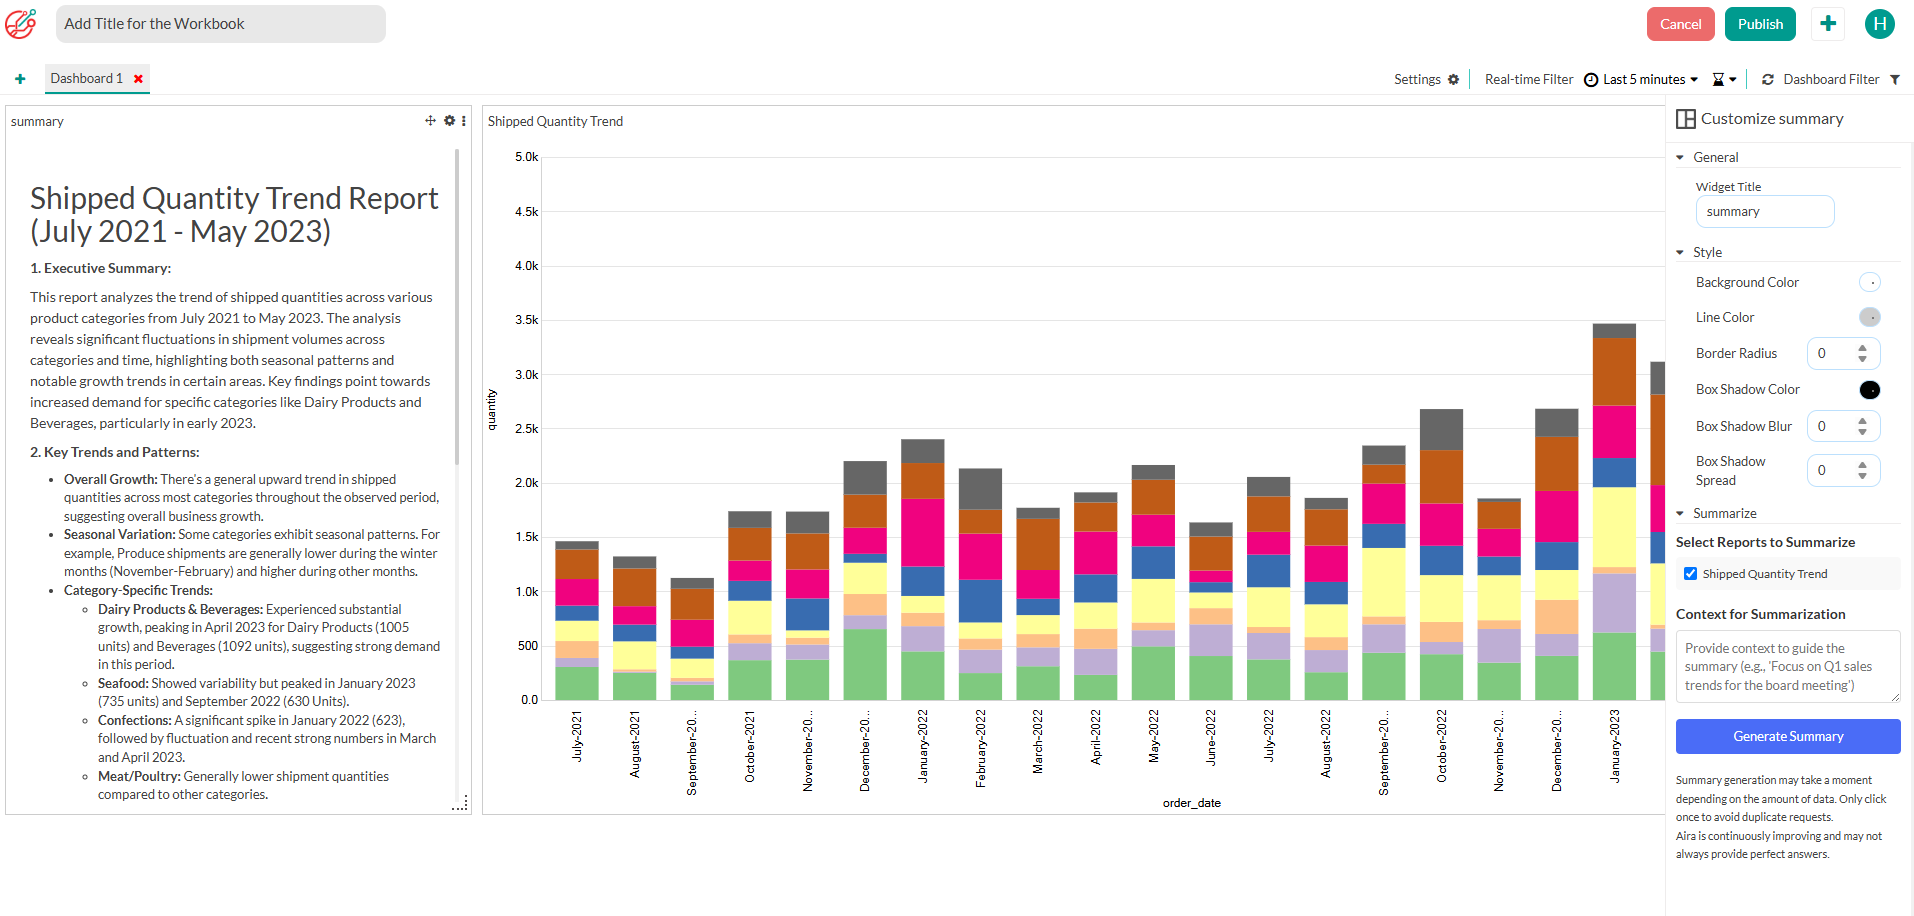
2. Automated Report Summaries (with Zero Data Exposure)
No more manual summaries. Grafieks now generates natural-language report overviews—without exposing raw data. These AI-written summaries give stakeholders quick, secure access to key takeaways.
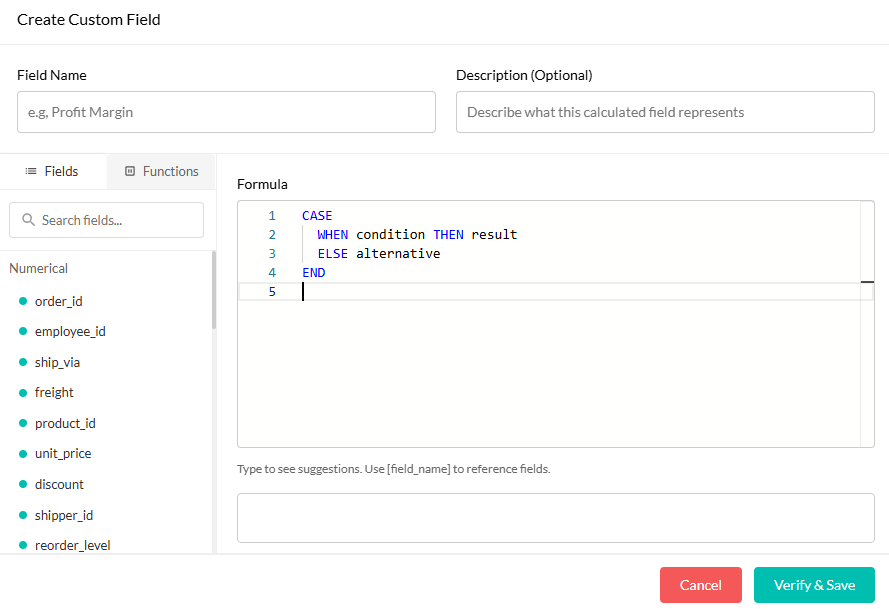
3. Custom Fields
You asked, we delivered. Create custom expression —no code or data team required. Define your own formulas, KPIs, and metrics using built-in functions and expressions tailored to your business needs, and see changes instantly reflected in visualizations.
4. Native dbt core Integration
Bring modeling and metrics to the forefront with first-class dbt Core support. Grafieks syncs your dbt projects—including models, tests, and descriptions—so your metrics are always in context and always up-to-date.
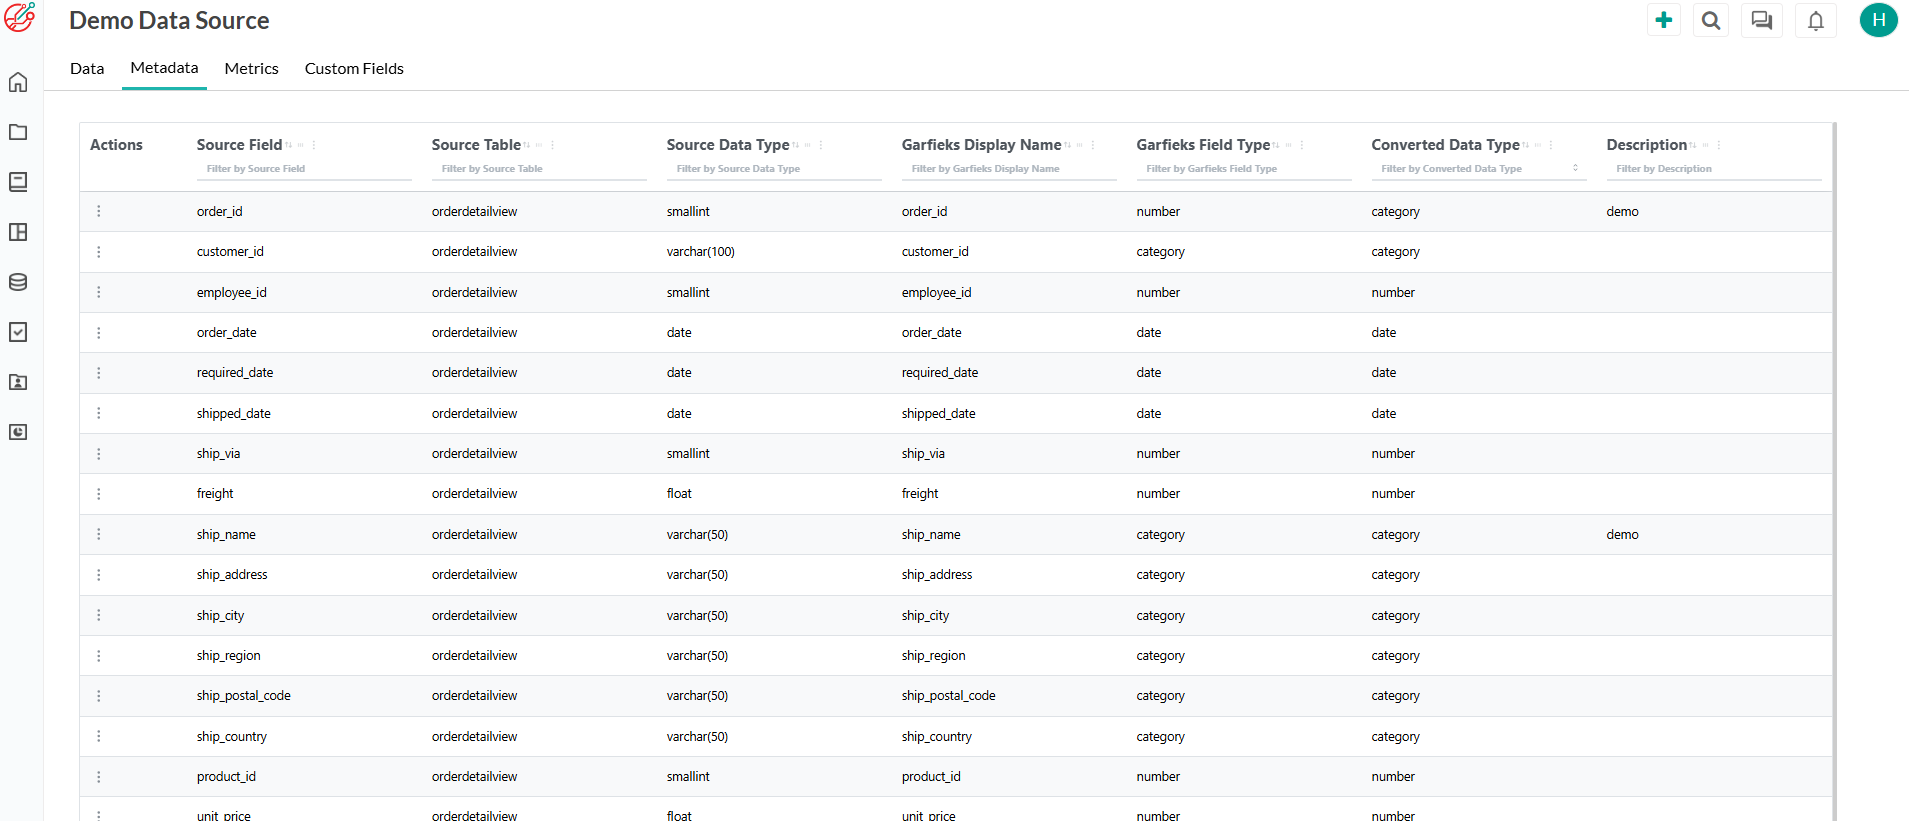
5. Unified Data Catalog
Explore your data in one place. Our new catalog view lets users browse tables, metadata, metrics from dbt, and custom fields—all searchable, all connected. Built for discovery and governance, side by side.