Funnel Chart
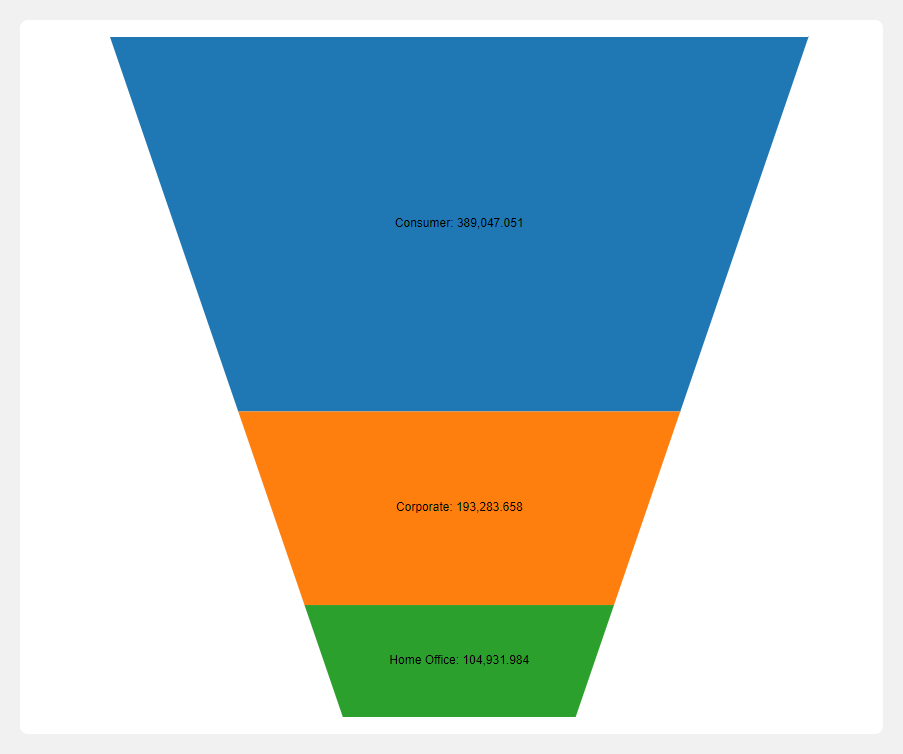
A funnel chart is a specialized data visualization used to represent the stages in a process and the relative size of each stage. Funnels are commonly used in sales to visualize how many customers are present within each step of a sales cycle. At their most general, funnels show you values broken out by steps, and the percent decrease between each successive step.
Steps to create funnel chart
- Select the Funnel chart from the list of available charts.
- Drag and drop a categorical or date field into the categorical drop zone.
- Drag and drop a numerical field into the numerical drop zone.
- Click the Get Result button to generate the chart.