Line Chart
A line chart is a type of data visualization that displays information as a series of data points (or markers) connected by straight line segments. It is primarily used to represent quantitative data over a continuous range, often time, making it an effective tool for identifying trends, patterns, and fluctuations in data.
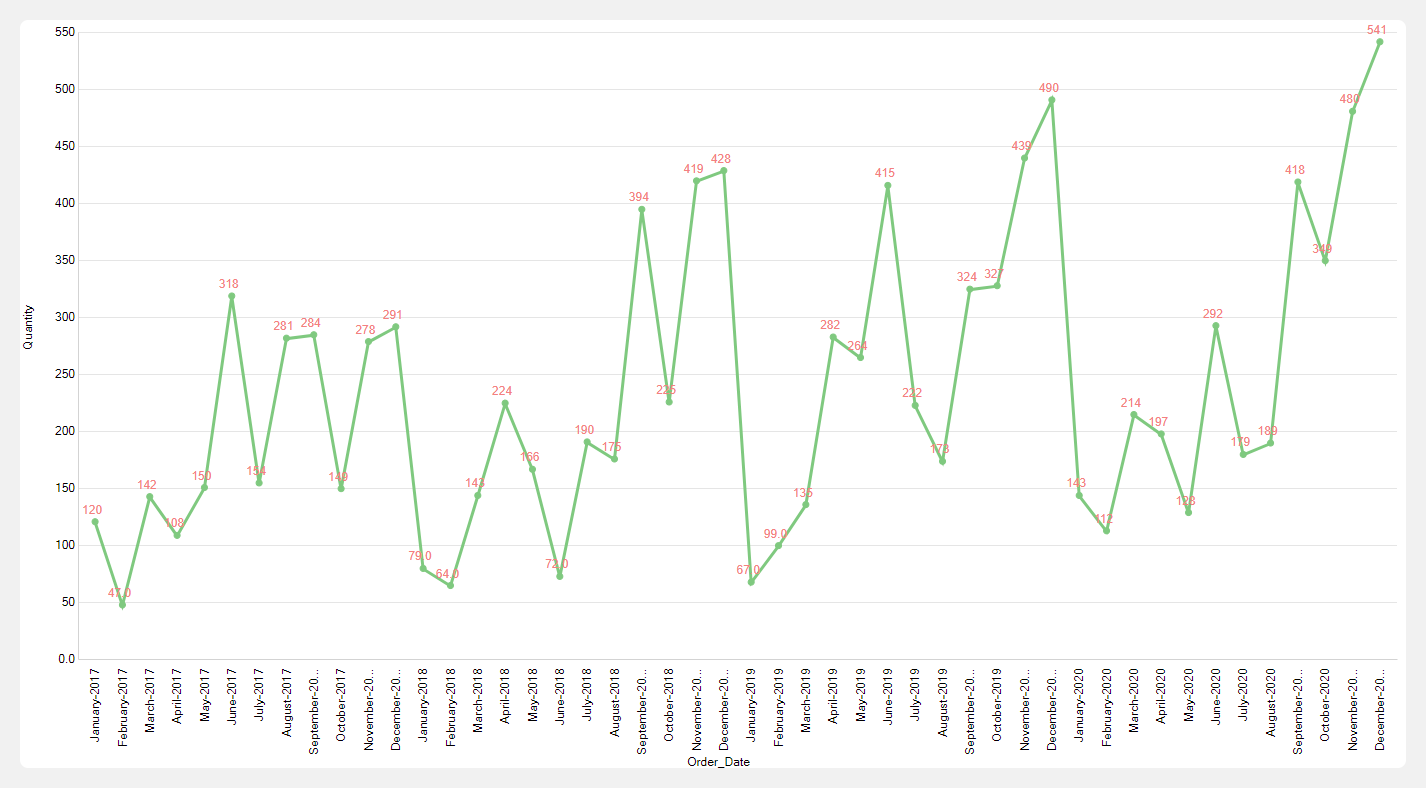
Steps to create line chart
- Select the Line chart from the list of available charts.
- Drag and drop a categorical or date field into the X-Axis drop zone.
- Drag and drop a numerical field into the Y-Axis drop zone.
- Click the Get Result button to generate the chart.